 |
Overview
The purpose of this page is to present a series of performance profile charts along with descriptive narrative illustrating the "as is" performance profile and basic risk management "cap" or "ceiling" oriented strategies that are suitable for end-users, marketers, and traders with net short "as is" positions. These charts are prepared on a per 10,000 MMBTU of natural gas production (or 1 contract) per month basis.
This page is organized into six main sections:
|
"As Is"
|
Discussion of the "as is" performance profile for end-users, marketers, and traders with net short positions. Also covers the major implications of this type of profile along with an overview of suitable strategies and tactics along with several critical risk management issues. |
|
Futures
|
Discussion of the performance profile of a long futures or fix/float swap (a swap wherein you pay fix and receive float). Also covers the resulting performance profile and management considerations when combined with the "as is". |
|
Calls
|
Discussion of the performance profile of a long call, cap, or ceiling. Also covers the resulting performance profile and management considerations when combined with the "as is". |
|
Puts
|
Discussion of the performance profile of a short put or floor. Also covers the resulting performance profile and management considerations when combined with the "as is". |
|
Fences
|
Discussion of the performance profile of a long fence or collar. Also covers the resulting performance profile and management considerations when combined with the "as is". |
|
Hedged Fences
|
Discussion of the performance profile of a hedged long fence or collar. Also covers the resulting performance profile and management considerations when combined with the "as is". |
|
|
|
End-user (Net Short) "As Is" Performance Profile
The following chart depicts the "as is" performance profile for end-users, marketers, and traders with net short positions, and clearly shows that when prices decline expenses decline and position valuations improve and when prices increase expenses increase and position valuations incur losses.
Caveat - Although the "as is" position for producers, marketers, and traders with net short positions produce similar performance profiles, each participant and each position will have different volume/position size, flow, timing, pipeline, contractual, and pricing (indexes, expiry dates…) opportunities and characteristics. Therefore, you need to carefully develop and evaluate your own "as is" performance profile(s) before you begin to implement strategies and tactics.
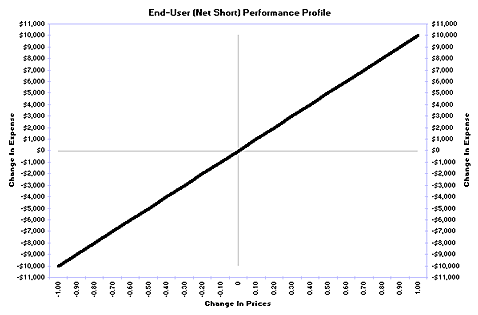
As you already knew, your risk exposure is clearly to rising costs and/or position valuation losses resulting from rising natural gas prices. More importantly, in addition to quantifying your risk exposure, the critical issue related to your "as is" performance profile is the establishment of a consistent analytic framework within which, and a commonly understood "as is" or baseline performance profile against which, the results of every strategy and tactical adjustment are to be evaluated.
"As Is" Performance Profile Implications
Assuming your objective is to manage your risk exposure to more acceptable levels, the implications of your "as is" performance profile include:
Suitable Risk Management Strategies
Given that your risk exposure is to rising prices, core risk management strategies need to benefit from rising prices so as to create gains to offset the concomitant increases in natural gas acquisition requirement expense or net short position valuation losses. Basic examples of the type of core risk management strategies that satisfy this requirement include (but are not limited to):
- Long futures or fix/float swaps (swaps wherein you pay fix and receive float).
- Long calls, caps, or ceilings.
- Short puts or floors.
- Long fences or collars.
- Hedged long fence or collar.
- Other combinations.
By no means is the foregoing a complete listing of suitable strategies for end-users, marketers, and traders with net short "as is" performance profiles. However, the strategies are fairly basic and easily understood, and, after examination, should provide some foundation for further inquiry and development on your part.
For a more in depth application to your specific situation, please click the Comments button or email us.
Timing of Implementing Risk Management Strategies
Notwithstanding academic hedging theory, and, given human nature and the common management objectives of end-users and marketers (or traders) with net short "as is" performance profiles, the ideal time, for the most part, to initiate each of these core risk management strategies is at the extreme trough of the underlying contextual price bias. Likewise, the ideal time, for the most part, to liquidate each of these core risk management strategies is at the extreme peak of the underlying contextual price bias. The only problem is that we do not "know", with certainty, when troughs and peaks are occurring. The best we can do, assuming a disciplined market analysis approach, is to establish probabilities of occurrence, and then initiate and liquidate strategies as a function of those probabilities within the context of our "as is" performance profile management objectives. Please refer to Natural Gas Swing Statistics. and Natural Gas Current Charts. for comments and charts relating to current market analysis.
There are three very important timing issues to be considered:
- There are several schools of thought regarding proper market analysis, e.g., fundamental, technical, cyclical, statistical, and so on. Each school has its own inherent strengths and weaknesses. These inherent strengths and weaknesses tend to be exposed or masked, and influence the resulting probabilities to varying degrees, depending on our individual understanding and discipline. As discussed throughout the Management Philosophy and Analytic Framework pages, we tend to favor an approach that blends a combination of the various schools.
- Regardless of our analytic methodology, we are seldom, if ever, 100% confident that our analysis is absolutely correct. Therefore, our strategy and tactical adjustment implementations need to be initiated and liquidated as a series of related events, as opposed to all at once as a single isolated event.
- For some end-users and marketers (or traders) with net short "as is" performance profiles, if the consequences of experiencing even a modest rise in prices would result in a catastrophic loss of business or trading capital, the need for a core risk management position is critical, regardless of the probabilities resulting from the analytic methodology.
Amount of Risk Exposure to be Stabilized
The amount of risk exposure to be stabilized is very closely related to the Timing issues discussed above. More specifically, the higher the probabilities of a trough in the underlying contextual price bias and the greater the consequences of loss of business or trading capital, the greater the volume or quantity of risk exposure needing to be stabilized. Likewise, the higher the probability of a peak in the underlying contextual price bias and the lower the consequences of loss of business or trading capital, the lower the volume or quantity of risk exposure needing to be stabilized.
Duration of Risk Exposure to be Stabilized
The timeframe of the risk exposure to be stabilized has a direct influence on the size and structure of risk management strategies. The ideal duration of risk exposure to be stabilized is the lesser of: a) the "normal" trough to peak move in the underlying contextual price bias, b) the life of the risk exposure inherent in the natural gas acquisition requirement stream or net short "as is" performance profile, or c) the effective duration of the alternative risk management strategies to be utilized.
Tactical adjustment are the key to maintaining strategic suitability of core risk management positions to changes in market environment and to changes in the "as is" performance profile risk exposure. There are two main types of tactical adjustments:
Scheduled
Changes in core risk management position attributable to known or anticipated changes/conditions relating to the underlying "as is" performance profile risk exposure. Examples include:
- Reduction of risk exposure due to the passage of time.
- Increases in natural gas acquisition requirements due to business expansion, etc.
- Scale-in additions during the latter stages of the current contextual down swing and early stages of the next contextual up swing.
- Scale-out reductions during the latter stages of the current contextual up swing and early stages of the next contextual down swing.
- Begin building the core strategy's risk control component (e.g., long puts) through out all stages of the current contextual down swing.
Unscheduled
Changes in core risk management position attributable to unknown or unanticipated changes in underlying "as is" performance profile risk exposure, and/or unanticipated or extreme changes in market price environment. Examples include:
- Unexpected changes in natural gas acquisition requirement stream.
- Extremely fast impulsive up swings at the operational level providing opportunity to liquidate risk management positions at more favorable price levels than implied by the underlying contextual bias.
- Corrective down swings at the operational level providing opportunity to initiate risk management positions at more favorable price levels than implied by the underlying contextual bias.
- Reductions in core risk management positions when impulsive down swings prove the perceived underlying contextual bias to be wrong.
|
Long Futures or Fix/Float Swaps
The following chart depicts the performance profile of a long futures or fix/float swap (a swap wherein you pay fix and receive float), and clearly shows that when prices rise position valuations result in gains and when prices decline position valuations result in losses. Just the opposite effect of the price changes on the expense stream from your acquisition requirements.
Caveat - Although long futures and long fix/float swaps produce similar performance profiles, they have different contractual, pricing (indexes, expiry dates…), transactional, credit, and liquidity opportunities and characteristics. Therefore, you need to carefully evaluate the relative performance profiles of each before implementing one versus the other.
Net Long Futures or Fix/Float Swaps
The following chart depicts the combined performance profile resulting from combining an end-user's "as is" performance profile minus a long futures or fix/float swap performance profile. The combination shows that regardless of whether prices rise or decline, the change in the net expense stream remains close to zero (plus transaction costs and slippage allowances).
Note: for comparison purposes, the end-user's "as is" performance profile is depicted as the light gray diagonal line.
Most end-users, marketers, and traders with net short "as is" performance profiles tend to like the fact that the resulting performance profile is flat during rising prices, but do not like foregoing the benefits associated with declining prices. (Note: this is also the same type of performance profile that would result from an end-user buying future or forward acquisition requirements via a fixed price contract.)
As a general rule, before management accepts this trade-off, there needs to be high confidence probabilities that prices are forming a trough at the underlying contextual price bias swing level and/or a persuasive fear that a catastrophic loss of business or trading capital consequences would result from even a minor increase in prices.
An ill advised time for an end-user, marketer, or trader with a net short "as is" performance profile to employ long futures or long fix/float swaps is when a volatile basis relationship is involved -- Especially, if adverse movements in the basis relationship are dominated by times, wherein, futures prices decline and cash prices stay flat or rise and there is more than a modest amount of concern about prices experiencing an extended move to the downside.
Commonly Asked End-user Question
"Is there another alternative that would allow some price protection to the upside, while still allowing some participation in the potential downside price movement opportunity?"
The next phase in developing an answer to this question is addressed in the next series of performance profiles (long calls, caps, or ceilings).
Implementation Issues
There are several key implementation issues to consider once you have decided to alter your "as is" performance profile. Several of these issues were briefly covered in the following bookmarked sections of this page:
For a more in depth application to your specific situation, please click the Comments button or email us.
Back to Top
|
Long Calls, Caps, Ceilings
The following chart depicts the performance profile of an at-the-money long call, cap, or ceiling and clearly shows that when prices increase position valuations rise and when prices decline position valuations decline to a fixed level reflecting the purchased premium plus transaction costs and slippage allowances.
Caveat - Although long calls, caps, and ceilings produce similar performance profiles, they have different contractual, pricing (indexes, volatility, strike prices, expiry dates…), transactional, credit, and liquidity opportunities and characteristics. Therefore, you need to carefully evaluate the relative performance profiles of each before implementing one versus the other.
Net Long Calls, Caps, Ceilings
The following chart depicts the combined performance profile resulting from the combination of an end-user's "as is" performance profile minus a long put or floor performance profile. The combination shows that when prices decline the change in net expense also declines, albeit at a higher level than the "as is" performance profile reflecting the purchased premium plus transaction costs and slippage allowances. The combination also shows that when prices increase, the change in net expense also increases, but reaches a "cap" or "ceiling" level reflecting the purchased premium plus transaction costs and slippage allowances and the amount to which the call, cap, or ceiling's strike price was out-of-the-money at purchase.
Note: for comparison purposes, the end-user's "as is" performance profile is depicted as the light gray diagonal line.
Most end-users, marketers, and traders with net short "as is" performance profiles tend to like the fact that the resulting performance profile has a "cap" or "ceiling" during rising prices, and participates, to some degree, in the benefits associated with declining prices. However, the key concern most often times expressed relates to the cost of the put or floor (purchased premium plus transaction costs and slippage allowances) and the remaining exposure to rising prices represented by the amount to which the option's strike price was out-of-the-money at purchase.
As a general rule, management accepts this trade-off when there is some confidence (but not high) in the probabilities that prices are forming a trough at the underlying contextual bias swing level, and there exists a concern that a catastrophic loss of business or trading capital consequences would result from an increase in prices above the option's strike price.
Another propitious time for an end-user, marketer, or trader with a net short "as is" performance profile to employ long calls, caps, or ceilings instead of long futures is when a volatile basis relationship is involved -- Especially, if adverse movements in the basis relationship are dominated by times, wherein, futures prices decline and cash prices stay flat or rise.
Commonly Asked End-user Question
"Is there another alternative that would allow some price protection to the upside, while still allowing some participation in the potential downside price movement opportunity, but, at a lesser purchased premium than long calls, caps, or ceilings?"
In addition to considering purchasing out-of-the-money calls, caps, or ceilings which cost less and protect less, the next phase in developing an answer to this question is addressed in the next series of performance profiles (short puts or floors).
Implementation Issues
There are several key implementation issues to consider once you have decided to alter your "as is" performance profile. Several of these issues were briefly covered in the following bookmarked sections of this page:
For a more in depth application to your specific situation, please click the Comments button or email us.
Back to Top
|
Short Puts or Floors
The following chart depicts the performance profile of a slightly out-of-the-money short put or floor, and clearly shows that when prices increase position valuations rise to a fixed level reflecting the premium sold minus transaction costs and slippage allowances, and when prices decline position valuations decline once prices decline below the option's strike price. This is a classic "unlimited risk, limited reward" performance profile. The primary reason for including this type of position in a risk management strategy is the ability to utilize the premium income to offset the premium cost of the long calls, caps, or ceilings.
The key tradeoff to this premium income is the losses incurred during declining prices. Additionally, puts and floors are oftentimes sold as a stand-alone position that is viewed as a partial hedge or expense improvement strategy (to the extent of net premium income) during rising prices.
This position is typically utilized when the trader has high confidence that probabilities favor rising prices, but feels that he does not have the financial resources to calls, caps, or ceilings.
Caveat - Although short puts and floors produce similar performance profiles, they have different contractual, pricing (indexes, volatility, strike prices, expiry dates…), transactional, credit, and liquidity opportunities and characteristics. Therefore, you need to carefully evaluate the relative performance profiles of each before implementing one versus the other.
Net Short Puts or Floors
The following chart depicts the combined performance profile resulting from the combination of an end-user's "as is" performance profile minus a short put or floor performance profile. The combination shows that when prices decline the change in net expense also declines, but reaches a "floor" level reflecting the premium income minus transaction costs, slippage allowances and the amount to which the option's strike price was out-of-the-money at sale. The combination also shows that when prices increase, the change in net expense also increases, albeit at a lower level than the "as is" performance profile reflecting the premium income minus transaction costs and slippage allowances.
Note: for comparison purposes, the end-user's "as is" performance profile is depicted as the light gray diagonal line.
Clearly, a short put or floor has limited benefits, and places a "floor" on expenses if prices decline below the option's strike price. As a stand alone position, it provides only modest protection during rising prices.
The most ideal time to employ as a stand alone position is when prices have a high confidence probability of being range bound between current prices and the option's strike price.
As with long futures, an end-user, marketer, or trader with a net short "as is" performance profile is ill advised to employ short puts or floors when a volatile basis relationship is involved -- Especially, if adverse movements in the basis relationship are dominated by times, wherein, prices underlying the option decline and cash prices stay flat or increase and there is more than a modest amount of concern about prices experiencing an extended move to the downside.
Commonly Asked End-user Question
"Since my exposure is to rising prices and short puts and floors provide limited upside protection, why would I want to employ them?"
The next phase in developing an answer to this question is addressed in the next series of performance profiles (long fences or collars).
Implementation Issues
There are several key implementation issues to consider once you have decided to alter your "as is" performance profile. Several of these issues were briefly covered in the following bookmarked sections of this page:
For a more in depth application to your specific situation, please click the Comments button or email us.
Back to Top
|
Long Fences or Collars
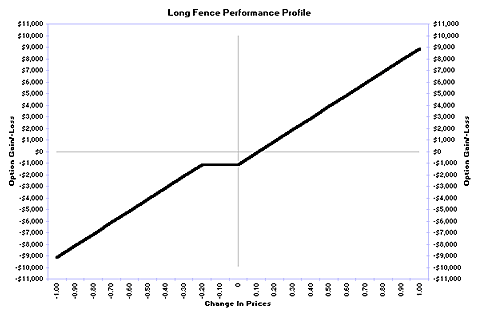
Long fences or collars are constructed by adding short puts or floors to long calls, caps, or ceilings (both of which have already been discussed).
The following chart depicts the performance profile resulting from this combination. As you can see, the profile is similar to a long futures positions with a period of horizontal values (depending on strike prices and expiry dates). The objectives of this combination include:
- Minimize the net premium outlay at the onset of an options oriented strategy.
- Create a range within which net expenses are bound, hence, the names "fence" or "collar".
Net Long Fences or Collars
The following chart depicts the combined performance profile resulting from the combination of an end-user's "as is" performance profile minus a long fence or collar performance profile. The combination shows that when prices decline the change in net expense also declines, but reaches a "floor" level reflecting the net premium, transaction costs, and slippage allowances, and the amount to which the put or floor's strike price was out-of-the-money at sale. The combination also shows that when prices increase, the change in net expense also increases, but reaches a "cap" or "ceiling" level reflecting the net premium, transaction costs, slippage allowances and the amount to which the call, cap, or ceiling's strike price was out-of-the-money at purchase.
Note: for comparison purposes, the end-user's "as is" performance profile is depicted as the light gray diagonal line.
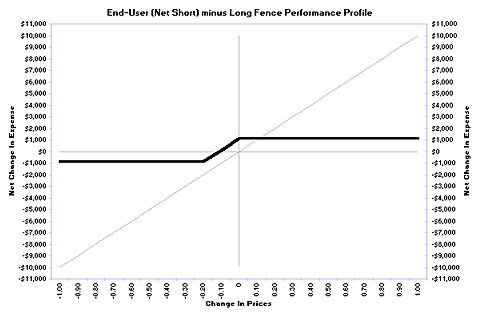
Many end-users, marketers, and traders with net short "as is" performance profiles tend to like the fact that the resulting performance profile comes close to matching the "as is" profile for price changes between the strike prices of the puts or floors on the downside, and the strike price of the calls, caps, or ceilings on the upside. They also tend to like the reduced net premium outlay at the inception of the strategy. And, they also tend to like the upside protection in the event of a catastrophic increase in prices above the strike price of the call, cap, or ceiling.
As a general rule, management is willing to accept the trade-off of these benefits versus foregoing the benefits associated with prices declining below the strike price of the puts or floors when they have at least a modest level of confidence in the probabilities that prices are forming a trough at the underlying contextual bias level and they do not have a persuasive fear that a catastrophic loss of business or trading capital consequences would result from even a minor increase in prices (i.e. they can withstand a minor increase in natural gas prices to the call, cap, or ceiling's strike price before becoming concerned about a catastrophic loss of business or trading capital).
As with long futures, an ill advised time for an end-user, marketer, or trader with a net short "as is" performance profile to employ long fences or collars is when a volatile basis relationship is involved -- Especially, if adverse movements in the basis relationship are dominated by times, wherein, prices underlying the puts or floors decline and cash prices stay flat or increase and there is more than a modest amount of concern about prices experiencing an extended move to the downside.
Commonly Asked End-user Question
"Is there another element that can be added to this strategy that would maintain most of the benefits, but, remove the 'floor' in the event of an extended price move to the downside?"
The next phase in developing an answer to this question is addressed in the next series of performance profiles (hedged long fences or collars).
Implementation Issues
There are several key implementation issues to consider once you have decided to alter your "as is" performance profile. Several of these issues were briefly covered in the following bookmarked sections of this page:
For a more in depth application to your specific situation, please click the Comments button or email us.
Back to Top
|
Hedged Long Fences or Collars
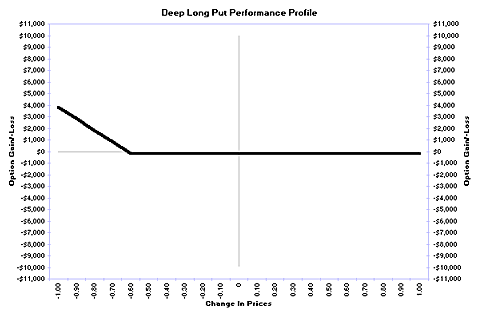
Hedged long fences or collars are created by adding an inexpensive long deep out-of-the-money put or floor to the previously described long fence or collar in order to remove the "floor" portion of the strategy in the event prices experience an extended move to the downside.
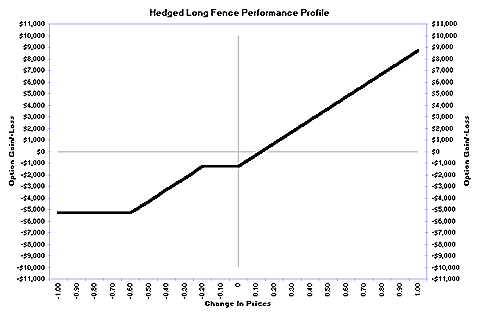
The following chart depicts the performance profile of a long deep out-of-the-money put or floor, and clearly shows that when prices increase position valuations decline to a fixed level reflecting the modest premium paid for the option plus transaction costs and slippage allowances. And, when prices decline, position valuations stay at the same level until prices underlying the option reach the option's strike price, at which time, position valuations rise.
Caveat - Although long puts and floors produce similar performance profiles, they have different contractual, pricing (indexes, volatility, strike prices, expiry dates…), transactional, credit, and liquidity opportunities and characteristics. Therefore, you need to carefully evaluate the relative performance profiles of each before implementing one versus the other.
The following chart depicts the hedged long fence performance profile which is the combination of; long calls, caps, or ceilings to protect against increases in prices, short puts or floors to partially pay for the long calls, caps, or ceilings, and long deep out-of-the-money puts or floors to eliminate the negative effect of the short puts or floors in the event of a sustained price movement to the downside.
Net Hedged Long Fences or Collars
The following chart depicts the combined performance profile resulting from the combination of an end-user's "as is" performance profile minus a hedged long fence or collar performance profile. The combination shows that when prices decline the change in net expense also declines, but reaches a "floor" level reflecting the premium received for the short put or floor minus transaction costs, slippage allowances and the amount to which the short put or floor's strike price was out-of-the-money at sale. Then, after a period of price movement (the difference between the short put or floor's strike price and the strike price of the long deep out-of-the-money put), the change in net expense once again begins to decline. The combination also shows that when prices increase, the change in net expense also increases, but reaches a "cap" or "ceiling" level reflecting the premium paid for the call, cap, or ceiling plus transaction costs, slippage allowances and the amount to which the call, cap, or ceiling's strike price was out-of-the-money at purchase.
Note: for comparison purposes, the end-user's "as is" performance profile is depicted as the light gray diagonal line.
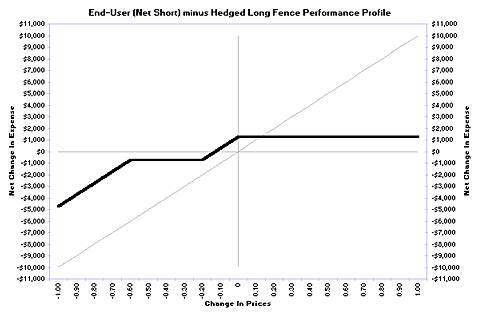
Many end-users, marketers, and traders with net short "as is" performance profiles tend to like the fact that the resulting performance profile comes close to matching the "as is" profile (plus transactional costs and slippage allowances) during price changes between the strike prices of the long calls, caps, or ceilings on the upside and the strike price of the short puts or floors on the downside. The flat price movement between the short put or floor's strike price and the long deep out-of-the-money put or floor's strike price reflects the extent of their willingness to forego some, but not all, of the benefits associated with a sustained price movement to the downside. They also tend to like the upside protection in the event of a catastrophic increase in prices above the strike price of the long call, cap, or ceiling.
Implementation Issues
There are several key implementation issues to consider once you have decided to alter your "as is" performance profile. Several of these issues were briefly covered in the following bookmarked sections of this page:
For a more in depth application to your specific situation, please click the Comments button or email us.
Back to Top
|
|
|